对程序进行性能优化的前提是知道程序性能瓶颈在哪里。本文记录 vallgrind 工具之 callgrind 来测试程序性能。
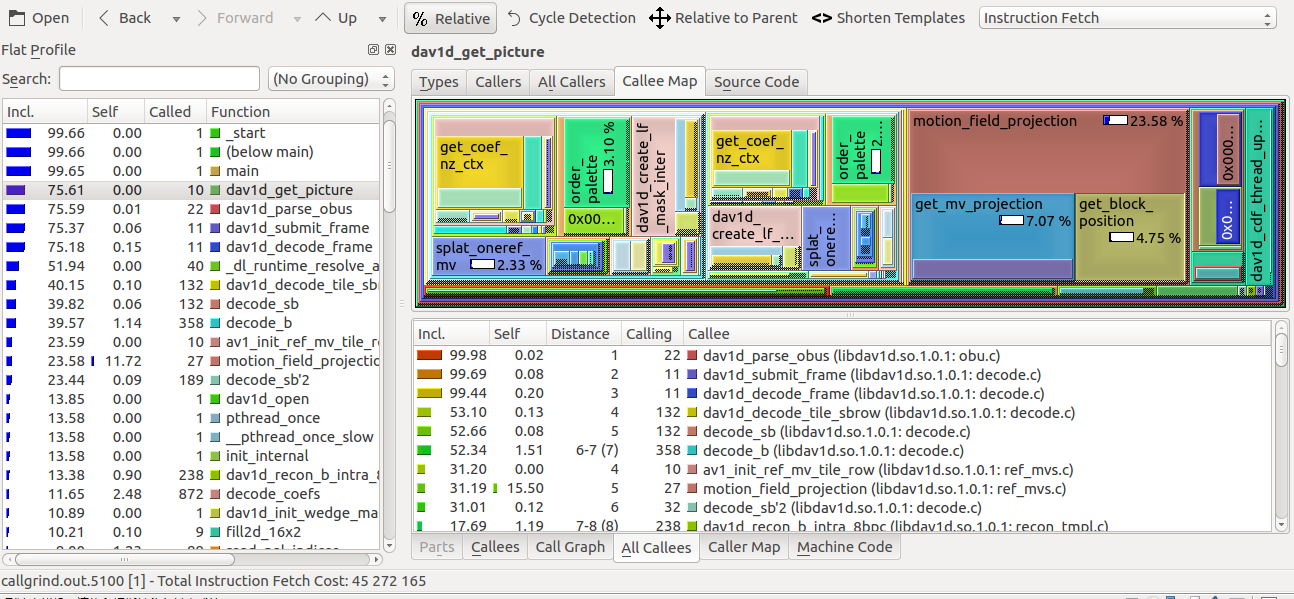
在优化 AV1 解码库时,使用 callgrind 和 kcachegrind 来检测程序性能,下面先给出测试结果,然后用一个小的程序进行逐步分析。
Callgrind 概述
使用该工具,必须在使用 valgrind 命令行时指定工具--tool=callgrind。
callgrind 是一个性能剖析工具,它记录一个程序运行时函数间调用历史。默认状态下,收集到的数据包括执行指令的个数、指令与源码行的对应关系、函数间调用和被调用的关系以及调用次数。除此外,模拟缓存和分支预测可能会产生更多关于应用程序运行的信息。
分析的数据在程序结束时会写到一个文件中。用于显示数据以及剖析互动控制,有如下两个命令 callgrind_annotate 和 callgind_control。
- callgrind_annotate 该命令读取 profile 数据,将函数占用时间打印出来,也可以使用图形化工具 Kcachegrind。
- callgrind_control 该命令在执行 callgrind 时,使我们可以交互的观察和控制当前运行程序的状态,而不用停止该程序。可以用该命令获取统计信息以及当前堆栈跟踪信息。
主要功能
cachegrind 主要是收集 flat profile 数据:数据读取和 cache 命中率等事件发生的次数直接归因于它们发生的函数。这种归因机制称为自我归因或独占归因。
callgrind 通过跨越函数调用边界的成本将 cachegrind 的功能进行扩展。如果函数 foo 调用 bar,从 bar 返回的消耗算到 foo 消耗里。当作为一只整体应用到程序中时,这就构建成了一个所谓的包容性成本的图片,即,每个函数的消耗包括它直接调用或间接调用的函数的消耗。
比如,main 函数的包容性消耗应该接近整个程序消耗的 100%。因为在调用 main 函数前,还会有其他初始的运行时间,因此最终的消耗只是接近 100%。
同调用图一起,可以清晰的看到从 main 开始的整个调用链,调用链上会清晰的给出程序主要消耗在什么地方。函数调用对剖析函数也是非常有用的,优化的机会一般取决于更改调用者的代码,尤其是降低调用次数。
callgrind 的 cache 模拟是基于 cachegrind 基础之上的。接下来的描述都是在 cachegrind 的特性基础之上进行的。
callgrind 的主要功能是依据它运行平台的指令集,检测函数调用和返回,它能很好地运行在 x86 和 amd64 平台上,但不幸的是在 ARM、PowerPC 或 MIPS平台上运行的并不好,因为这些平台上没有明确的调用和返回指令。
基本使用方法
和 cachegrind 一样,必须在编译时添加-g选项来获取调试信息,并且要将优化选项打开。启动剖析程序,只需执行如下命令:
1
| |
程序运行过程中,想要观察执行情况,只需要执行如下命令callgrind_control -b。
程序运行完成后,会生成一个名为callgrind.out.<pid>的文件,其中 pid 就是程序的线程 ID。该文件就包含了程序执行过程中各个函数的调用情况以及指令读取(Instruction Read(Ir))情况。
想要从 profile 数据文件中生成函数的总结,使用callgrind_annotate [options] callgrind.out.<pid>。该命令与 cachegrind 中的cg_annotate类似,函数会按照消耗排序。callgrind 的额外的重要的特性是如下两个选项:
--inclusive=yes:使用该选项后,会使用并显示包容性消耗的函数排序,而不是独立性消耗的排序。--tree=both:
高级使用方法
生成多个 profile 文件
有些时候,我们对完成程序运行的特性并不关心,而只是关注其中很小的一部分,比如执行某个算法。如果有多个算好或一个算法有不同的输入数据,一个单独程序运行的不同部分的 profile 数据是非常有用的。profile 数据文件有如下形式的名字callgrind.out.pid.part-threadID。
dump 多个 profile 文件的方法和形式有多种,举例如下:
- Dump on program termination, 该方法就是标准的方法,不需要额外的做任何操作。
- Spontaneous,interactive dumping,使用
callgrind_control -d [hint [PID/Name]]来使得 profile 信息的dump带有 PID 或 Name。hint 是可以随意指定的字符串用于区分 profile dump 文件。dump 结束前,控制程序不会停止。注意,为例检测 dump 命令,应用程序必须处于运行态。如果你使用的是Kcachegrind,想要查看 profile 信息,可以使用工具栏按钮Force dump,就会发起一个 dump 请求。 - Periodic dumping after execution of a apecified number of basic blocks,使用
--dump-every-bb=count选项。 - Dumping at enter/leave of specified functions。使用
--dump-before=function和--dump-after=function选项。想要在进入某个函数前清零计数器,使用--zero-before=function选项。针对不同的函数,可以多次使用该选项。而且函数名可以使用如下形式--dump-before='foo*',它会为每个函数名的开头为 foo 的函数生成 dump 文件。 - Program controlled dumping。在需要 dump profile 发送的代码中插入
CALLGRIND_DUMP_STATS。使用CALLGRIND_ZERO_STATS清零 profile 计数器。
如果你正运行一个多线程应用程序,在命令行使用--separate-threads=yes选项,每个线程都会生成单独的 profile 文件。因此上面的最后两种方法只会生成当前运行线程生成的 dump 文件,其他方法,则会为每个线程生成多个dump文件。
限制收集事件的范围
默认情况下,当事件发生时(比如指令执行或cache命中或未命中),callgrind 即可将这些事件计入事件计数器。但有时我们只对某个特定的函数或者一段程序代码感兴趣,函数或某段代码结束后,就不在将额外的部分计入事件计数器。
Callgrind 命令行选项
dump 生成选项
--callgrind-out-file=<file>选项影响 profile 数据文件的名称和格式,该选择指定 profile 数据写到 file 中而不是默认的输出文件callgrind.out.<pid>文件。--dump-line=<no|yes> [default:yes],该选项指定事件计数应该以源码行执行。这对于编译时带有调试信息的源码。--dump-instr=<no|ys> [default:no], 该选项指定事件计数应该以指令执行。这允许汇编。当前结果可以通过 KCachegrind 显示。--compress-strings=<no|yes> [default:yes],该选项会影响 profile 数据的输出格式。它指定文件和函数名是否用数字区分。他会压缩文件,但使得更加难以读取。--compress-pos=<no|yes> [default:yes],该选项会影响 profile 数据的输出格式。它指定数字位置是绝对值还是相对值。--combine-dumps=<no|yes> [default:no], 不推荐,使能该选项后,多个 profile 数据会追加到同一个输出文件。
activity 选项
这类选项指定与事件计数相关的行为什么时候发生。对于交互控制,使用 callgrind_control 控制。
--dump-every-bb=<count> [default:0, never],Dump profile data every count basic blocks。--dump-before=<function>,进入函数前 dump。--zero-before=<function>, 进入函数前清零所有消耗统计。--dump-after=<function>, 推出函数时 dump。
data collection 选项
此类选项指定何时将事件聚合到事件计数中。
--instr-atstart=<yes|no> [default:yes],--collect-atstart=<yes|no> [default:yes],--toggle-collect=<fucntion>,--collect-jumps=<no|yes> [default:no]--collect-systime=<no|yes> [default:no], 该选项指定系统调用的信息是否要被收集。--collect-bus=<no|yes> [default:no], 该选项指定全局总线事件的数量是否被收集。
cost entity separations 选项
simulation 选项
--cache-sim=<yes|no> [default:no],该选项指定是否做高速缓存模拟。默认情况下,只有指令读访问才会被计数(Ir)。如果启动高速缓存模拟,会有更多的事件被计数:指令读取的高速缓存命中率(I1mr/ILmr),数据读取访问(Dr)以及相关的数据读取缓存miss(D1mr/DLmr),写数据访问(Dw)以及相关的cache misses(D1mw/DLmw)。--branch-sim=<yes|no>[default:no],该选项指定是否做分支预测模拟。使能该选项后,会有更多的事件计数被启动:执行分支预测的数量以及相关的分支miss(Bc/Bcm),执行的间接跳跃和相关的跳转地址预测的miss(Bi/Bim)。
cache simulation 选项
--simulate-wb=<yes|no> [default:no],该选项指定是否对写块行为进行模拟。--simulate-hwpref=<yes|no> [default:no],该选项指定是否对硬件预取器的模拟。--cacheuse=<yes|no>[default:no],该选择指定是否对高速缓存行的使用进行收集。--I1=<size>,<associativity>,<line size>或--D1=<size>,<associativity>,<line size>或--LL=<size>,<associativity>,<line size>。
callgrind_annotate 命令行选项
--show=A,B,C [default:all], only show figures for events A, B, C.--sort=A,B,C,sort columns by events A, B, C[event column order], Optionally, each event is followed by a : and a threshold, to specify different thresholds depending on the event.--threshold=<0--100> [default:99%], Percentage of counts(of primary sort event) we are interested in.--auto=<yes|no> [default: no], Annotate all source files containing functions that helped reach the event count threshold..--context=N [default: 8], Print N lines of context before and after annotated lines.--inclusive=<yes|no> [default: no], Add subroutine costs to functions calls.--tree=<none|caller|calling|both> [default: none], Print for each function their callers, the called functions or both..-I, --include=<dir>, Add dir to the list of directories to search for source files.
callgrind_control 命令行选项
(未完待续。。。)