Gprof 是一个 Unix 应用程序性能分析工具。
gprof 概述
Profiling 可以使我们看到程序运行时程序的调用关系、函数的消耗时长等。这些信息可以使我们了解程序中那块代码耗时高于预期。
使用 Profiling 主要包括如下三步:
-
编译链接程序时要使能 profiling 。
-
执行编译处的可执行文件,产生 profile 数据文件。
-
使用 gpro 分析 profile 数据。
根据产生的 profile ,可以产生各种不同实行的分析输出。如 The Flat Profile、The Call Graph、The Annotated Source Listing。
gprof 示例代码
示例分析:
1 2 3 4 5 6 7 8 9 10 11 12 13 14 15 16 17 18 19 20 21 22 23 24 25 26 27 28 29 30 31 32 33 34 35 36 37 | |
编译,注意要添加-pg选项,这样才能与后面的 gprof 结合使用。
1
| |
执行, 执行完毕后,会生成 gmon.out 文件,用于性能分析的文件。
1
| |
分析, 使用 gprof 分析。
1
| |
此时生成的分析文件 analysis.txt 中有两种形式的分析数据。
Flat Profile 示例图
Flat Profile 如图:
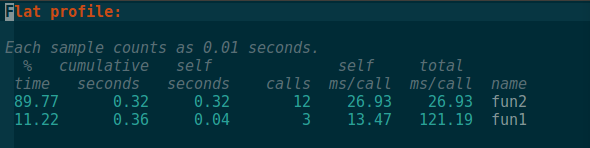
| 标注 | 释义 |
|---|---|
| %time | 每个函数占用的时间比例,所有函数占比和为100% |
| cumulative seconds | 函数及其调用函数执行累计占用时间 |
| self seconds | 单独函数执行累计占用时间 |
| calls | 函数调用次数 |
| self ms/call | 每次调用函数花费的时间,单位毫秒, 不包含调用函数运行的时间 |
| total ms/call | 每次调用函数花费的时间,单位毫秒,包括调用函数运行的时间 |
| name | 函数名称 |
Call Graph 示例图
Call Graph 如图:
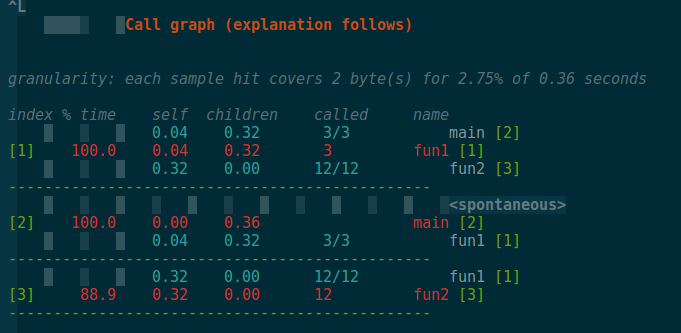
| 标注 | 释义 |
|---|---|
| index | 每个函数第一次出现时分配一个编号,根据编号可以方便查找函数的具体分析数据 |
| %time | 函数以及调用子函数所占用的总运行时间的百分比 |
| self | 函数的总运行时间 |
| children | 子函数执行的总时间 |
| called | 函数被调用的次数,不包括递归调用 |
| name | 函数名称, name 列中,可查看函数之间的调用关系 |